Chrome DevTools Protocol (CDP) is a low-level protocol for inspecting and controlling Chromium-based browsers. It exposes browser capabilities such as JavaScript execution, DOM inspection, network monitoring, and page rendering through structured messages.
Chrome DevTools, the developer interface built into Chrome, uses this protocol to communicate with the browser. CDP also serves as the foundation for many browser automation libraries, most notably Playwright and Puppeteer. Recently, the protocol surged in popularity due to its adoption by AI-powered browser agents. CDP works in both headful and headless mode.
In this article, we'll explain how CDP works, what it can do, and how to use it through a practical example.
How Does CDP Work?
CDP uses bidirectional communication and follows a client-server model. The client sends commands, and the browser returns responses. The browser also sends events when something happens, such as when a request starts or a page finishes its initial load.
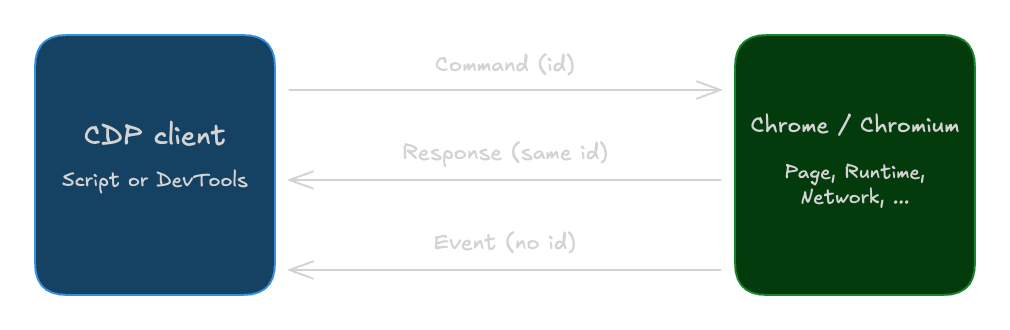
Communication typically happens over a WebSocket connection, but OS-level pipes are also supported for local communication.
CDP's capabilities are grouped into domains. For example, Page handles navigation, Runtime evaluates JavaScript, Network reports requests and responses, and Tracing records performance data.
JSON-RPC-Based Messages
CDP uses an adapted form of JSON-RPC, a remote procedure call protocol:
- A command has an
id, amethod, and optionalparams. - Its response repeats the
idand containsresultorerror. - An event has a
methodand potentiallyparams, without a requestid.
This lets the client match responses to commands while receiving events independently.
CDP messages normally omit the jsonrpc version field required by JSON-RPC 2.0, so describing CDP as fully compliant with JSON-RPC 2.0 is inaccurate.
Targets and Sessions
Targets and sessions are two of the most important concepts in CDP.
A target is something you can debug or control. That can be a page, tab, iframe, worker, and so on. Each target generally has a targetId.
A session, on the other hand, is the connection you use to communicate with a specific target. When you attach to a target, Chrome gives you a sessionId, which tells Chrome which target your commands are meant for.
Here's an example to better understand how they're connected:
Chrome Browser
│
├── Target: Tab A
│   └── Session A
│       ├── Runtime.evaluate
│       ├── Network.enable
│       └── Page.navigate
│
├── Target: Tab B
│   └── Session B
│
└── Target: Service Worker
    └── Session C
What Can You Use CDP For?
CDP supports tasks ranging from diagnostics to browser automation.
Testing and Debugging
You can inspect network traffic, capture console output, emulate device settings, and collect performance traces. These capabilities can help you understand why a page behaves differently under particular conditions.
Scraping and Document Generation
CDP can also be used for scraping and document generation. JavaScript evaluation and DOM inspection expose rendered content, while screenshot and PDF commands can capture the page's visual output.
Note that for this use case, you're usually better off using an automation library. More about this in a later section.
Want to learn web scraping? Check out The Ultimate Guide to Web Scraping.
Browser Agents
The protocol can also be used for giving AI-powered browser agents control over your browser. Because CDP uses a standardized JSON protocol, agents can easily take control by generating commands and interpreting responses.
CDP Limitations and Common Pitfalls
Moving along, let's look at some common pitfalls.
Browser and Version Compatibility
CDP is mainly designed for Chromium-based browsers. If you need standardized automation across different browsers, you'll have to use WebDriver or WebDriver BiDi.
Playwright supports multiple browsers, but that doesn't mean it uses CDP for all of them. Its connectOverCDP method only works with Chromium and provides less functionality than Playwright's normal connection.
CDP support can also vary between browser versions. New or experimental commands may not exist in older versions of Chrome. You can check the protocol supported by a running browser at /json/protocol.
Complex State Management
Pages and targets can change while your program is running. For example, navigating to a new page can destroy existing JavaScript execution contexts and invalidate old remote object IDs.
New tabs, frames, and workers can also create new targets that you may need to attach to and clean up later.
A script that works for one simple page doesn't automatically handle these changes.
| Symptom | What to check |
|---|---|
| A page command fails on the browser connection | Attach to the page target and use its session ID. |
| A load event never arrives | Enable Page events and start listening before navigating. Also use a timeout. |
| A method isn't found | Check the CDP domain, target type, and the protocol version supported by your browser. |
When Should You Use CDP Directly?
For most automation, start with a library and add lower-level control where needed.
Playwright or Puppeteer
Use these for tests, scraping, forms, and screenshots. They provide page and locator APIs; Playwright also waits for elements to be actionable. You write the workflow instead of managing protocol messages.
To learn how these tools compare with Selenium, see Playwright vs Selenium vs Puppeteer.
CDP Sessions
Use a library's CDPSession when you need a Chromium command or event its normal API doesn't expose. You keep the library's navigation and selectors while sending selected protocol commands.
Direct WebSocket Commands
Use these for learning CDP or building protocol tooling. You manage response IDs, timeouts, errors, and target lifetimes. Chrome's Protocol Monitor helps you inspect messages before implementing them.
Practical Example: Navigate and Read a Page Title
Let's put CDP into practice. We'll connect to headless Chrome, navigate to a page, and read its title from Node's interactive console.
This walkthrough was tested on macOS with Chrome 153.0.8010.53 and Node.js 22.22.3.
Start Chrome (with CDP enabled)
First, start Chrome with remote debugging enabled. Open a terminal and run:
"/Applications/Google Chrome.app/Contents/MacOS/Google Chrome" \
  --headless \
  --remote-debugging-port=9222 \
  --user-data-dir="/tmp/cdp-article-profile" \
  about:blank
Here, --remote-debugging-port enables debugging on port 9222. We use --user-data-dir for a separate profile, which regular Chrome requires.
If that port is taken, use another throughout the example. Keep it off the public internet: anyone who connects could control Chrome.
Leave Chrome running while we connect from another terminal.
Connect to the Page
Next, open another terminal and start Node's interactive console:
nodeEnter these statements individually, waiting for the > prompt after each:
const response = await fetch("http://127.0.0.1:9222/json/list");
const targets = await response.json();
const page = targets.find(target => target.type === "page");
page.webSocketDebuggerUrl
Here, we fetch Chrome's targets and select a page. You should see its WebSocket address, something like ws://127.0.0.1:9222/devtools/page/.... We'll send our commands there.
Next, connect to the WebSocket:
const ws = await new Promise((resolve, reject) => {
  const socket = new WebSocket(page.webSocketDebuggerUrl);
  socket.onopen = () => resolve(socket);
  socket.onerror = reject;
});
Once the prompt returns, add a handler to print Chrome's responses and events:
ws.onmessage = ({ data }) => console.log(data);We're now connected directly to the page, so we don't need a sessionId.
Enable Events and Navigate
Before navigating, enable Page events so Chrome can tell us when the page loads:
ws.send(JSON.stringify({ id: 1, method: "Page.enable" }));You should receive the following response before continuing:
{ "id": 1, "result": {} }Notice the matching id: this response belongs to our command. An empty result means it succeeded without returning additional data.
Next, let's tell Chrome to navigate to Example Domain:
ws.send(
  JSON.stringify({
    id: 2,
    method: "Page.navigate",
    params: { url: "https://example.com" },
  })
);
You should see a response and page events. Look for these messages; IDs are shortened and unrelated events omitted:
{
  "id": 2,
  "result": {
    "frameId": "A7789DDD...",
    "loaderId": "C6E15414...",
    "isDownload": false
  }
}
{
"method": "Page.loadEventFired",
"params": {
"timestamp": 181921.758042
}
}The command's response doesn't mean loading has finished. Wait for Page.loadEventFired before moving on. Our handler catches this event because we installed it before navigating.
If navigation fails, check error or result.errorText. For dynamic apps, also wait for the content you need; document load doesn't guarantee it's ready.
Read the Title and Disconnect
With the document loaded, let's read its title using Runtime.evaluate to run document.title:
ws.send(
  JSON.stringify({
    id: 3,
    method: "Runtime.evaluate",
    params: {
      expression: "document.title",
      returnByValue: true,
    },
  })
);
You should get a response like this:
{
  "id": 3,
  "result": {
    "result": {
      "type": "string",
      "value": "Example Domain"
    }
  }
}
You can find Example Domain at result.result.value. The outer result holds the response; the inner one describes the JavaScript value. Check result.exceptionDetails if evaluation fails.
Finally, let's close the connection:
ws.close();Then exit Node:
.exitThe Same Task With Puppeteer
Let's look at how we could perform the same task using Puppeteer.
First, install it:
npm install --save-exact puppeteer-core@25.11.0Next, create puppeteer-demo.mjs and add the following code:
import puppeteer from "puppeteer-core";

// Connect to the Chrome instance we already started.
const browser = await puppeteer.connect({
  browserURL: "http://127.0.0.1:9222",
});
try {
  // Reuse its open page and wait for document load.
  const [page] = await browser.pages();
  await page.goto("https://example.com", { waitUntil: "load" });
  console.log("Title:", await page.title());
} finally {
  // Disconnect, leaving Chrome running.
  await browser.disconnect();
}
Execute the script:
node puppeteer-demo.mjsYou should see Title: Example Domain. This time, page.goto() navigates and waits for document load, while page.title() retrieves the title.
As you can see, doing the same thing with Puppeteer is way easier. It doesn't require sending raw commands, reading CDP responses, juggling sessions, and so on.
When you're finished, stop Chrome with Ctrl+C in the terminal where you started it.
Conclusion
CDP gives software direct access to Chromium's browser capabilities, making it useful for debugging, scraping, and AI-powered browser agents. Its commands, responses, and events let programs inspect what's happening and act on it.
The tricky part is managing a browser that keeps changing. Pages navigate, targets appear and disappear, and commands vary between versions. Understanding how domains, targets, and sessions fit together helps you handle those changes and troubleshoot automation, even when a library handles the protocol for you.
If you need a remote browser for your existing automation, Browser Use Browser Infrastructure provides CDP-compatible browsers you can control with Playwright or Puppeteer.