
Our agent needed 30.7 seconds to find the three cheapest flights from Zurich to London. Six causes explain most of it, and you can check every one of them in your own agent. One of them was a "page is quiet" detector that never fired, because Google Flights rewrites a CSS class on every frame.
Careful with the headline: 30.7 s is our staging stack on Sep 27, 18 s is prod on Oct 9, and about 3.4 s of the 18 is model time we still can't explain.
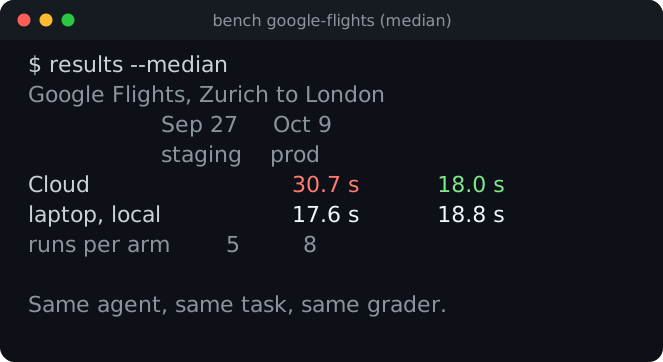
The task: Google Flights, one way, fixed date, report the 3 cheapest. The grader wants at least 3 distinct prices and the expected cheapest carrier. We kept the model and fixed everything around it. Agents did most of the work, running one change at a time behind a flag with a judge checking that nothing got faster by doing less (how we run evals). Launch numbers are in BU Ultrafast is live, and older tricks like KV cache and fewer screenshots are in Speed Matters.
Where the 13 seconds went
Event timestamps split every run into startup, model, tools, wrap-up and poll. Here is the gap between our cloud setup and the same agent driving a local Chrome, by cause. Local Chrome is the floor: no network hop, no proxy.
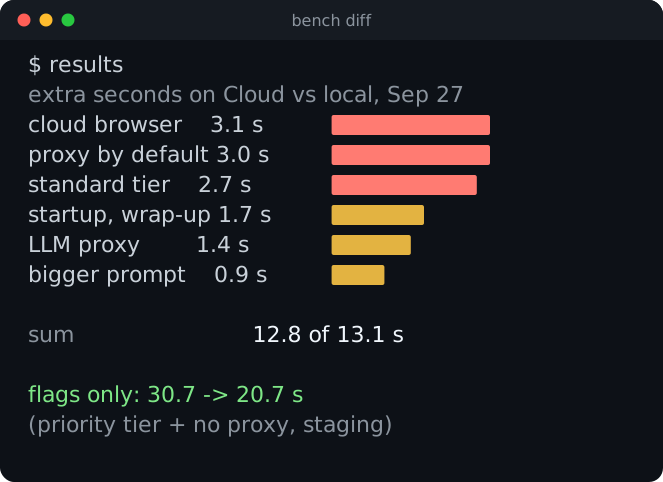
Two of them are config, so start there.
We called OpenAI on the standard tier, and the local run used priority. Priority costs 2x per token and, on the replica, took mean turn time from 1.20 to 1.02 s (p90 1.81 to 1.41 s), about 1.9 s off a 12-turn run.
Every run also went through a residential proxy. Now the agent starts direct and moves to a proxy browser when a site blocks it. On Oct 9 the same harness with a US proxy was still 5.3 s slower (25.3 vs 20.0 s, n=8).
Those two flags alone took Flights from 30.7 to 20.7 s and example.com from 10.3 to 6.5 s. That's 10.0 s saved, more than the 5.7 s their bars add up to, so read the chart as a rough split.
The rest: a cloud browser that read the accessibility tree in 46 ms instead of 12 and made about 260 CDP calls per run, a cold Node start per run, an LLM proxy holding the stream open for billing, and a longer prompt.
While we were in there we found that with no explicit model params, our harness ran GPT-6 Luna at xhigh reasoning effort. One Flights run took 141 s and 39 model calls.
85 ms per call adds up
Our first reproduction ran on a laptop and took about 40 s on Flights, slower than staging. The laptop sat across the country from the cloud browsers, so every CDP call cost about 85 ms. Two steps took 8.2 and 8.7 s, roughly 100 sequential calls each (an estimate, not a count).
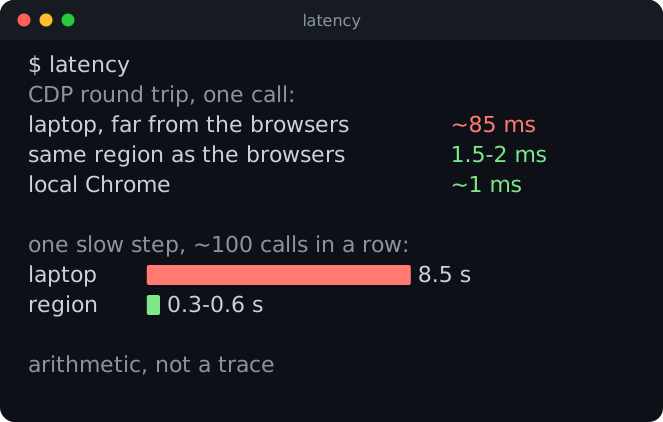
We benchmarked from a laptop across the country from the browsers and measured the distance. Run the benchmark where prod runs. Even in region, 260 calls at 3 to 6 ms is still about a second, so it pays to send fewer of them.
The page that never goes quiet
Every action waits for the page to settle: document parsed, no fresh requests in flight (older than 1.5 s counts as long-poll or analytics), and no DOM mutation for 80 ms. It gives up at 800 ms, or 3,000 ms while the page is loading.
On Flights, every settle ran to the 800 ms cap. Google Flights rewrites a class on the page every frame with the same value. A MutationObserver reports that as a change, so the quiet detector never saw quiet.
// Writing an attribute's current value changes nothing
// (Google Flights rewrites a class every frame).
if (
  r.attributeName &&
  r.oldValue === (r.target as Element).getAttributeNS(r.attributeNamespace, r.attributeName)
)
  continue;
A second rule: a style change only counts if it is the first on its element in 200 ms. So a menu opening still counts, and an animation loop doesn't.
The same change set also stopped re-probing every 40 ms. It cut CDP calls on a Flights run by about 30% with scores, model calls and cost unchanged (PR #19). The no-op fix shipped inside it, so we only have the combined number: 0.5-1.4 s per task on the replica.
Three related ideas lost, because in region the page itself only waited about 0.2 s per action.
The captcha detector was eating the main thread
On Sep 27 a probe showed the cloud browser's main thread blocked 674-698 ms in every 2 s window. Locally, zero.
We suspected the always-on captcha detector, and an agent tested it overnight. With it on, Flights burned 32-35% main-thread CPU while idle. Off, zero. Runtime.evaluate on the results page went from about 110 ms to 76 ms.
Ultrafast browsers now start with the solver off. When the agent hits a captcha it calls a solve_captcha tool that turns it on until the captcha is solved.
On Oct 9 the stall was gone with the solver on or off, so some other browser change in those two weeks also fixed it. We never found which.
Our own prompt made us slower
The full Cloud prompt and tool set on ultrafast cost 1.16x the time and 1.70x the money at the same score (paired evals, Sep 28). So Cloud now runs plain Pi with a short prompt. The first model call shrank from 5,578 to 2,740 tokens for API runs. None of 99 tasks flipped between pass and fail, and it came out 20% cheaper.
One cache bug was worth fixing on its own. On the last allowed step the harness swapped the tool list down to the two finish tools. Tools are part of the cached prefix, so that turn re-sent the whole context uncached. Keeping the list fixed and restricting the turn with OpenAI's allowed_tools cut agent cost 10-17% on two of three benchmarks, scores unchanged (PR #20).
The first model call used to wait for browser assignment, session restore and a tab pick, one after another. Now the restore runs while the browser is assigned.
All the fixes together
All winners together, on a replica of Cloud that sits in the browsers' region, against the old config.
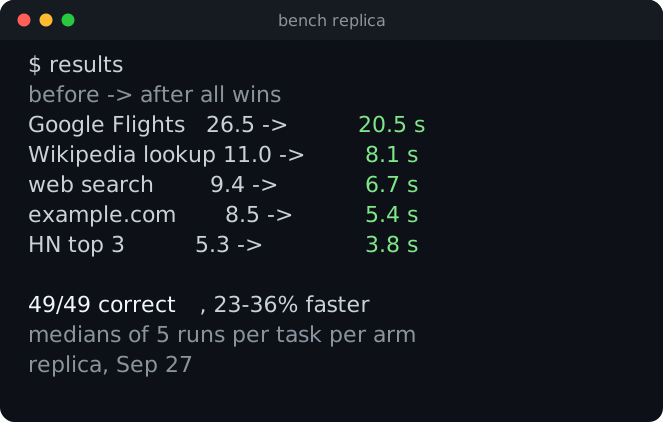
Then the real test on prod, Oct 9, Flights, 8 runs per arm:
| Setup | Total | Model | Browser | Correct |
|---|---|---|---|---|
| Laptop + local Chrome | 18.8 s | 13.5 s | 5.1 s | 5/8 |
| Prod Cloud, bu-ultrafast | 18.0 s | 9.6 s | 6.4 s | 7/8 |
| Harness in region + cloud browser | 20.0 s | 13.0 s | 6.5 s | 8/8 |
| Same, with US proxy | 25.3 s | 13.9 s | 11.6 s | 8/8 |
Medians over all 8 runs, misses included. The laptop ran the same harness commit Cloud runs, and Cloud's total includes about 1.6 s of startup.
The unexplained part: Cloud's model time was 3.4 s lower than the same harness calling OpenAI directly from the same region (9.6 vs 13.0 s), with the same turns and priority tier verified on both. Without that gap, Cloud would be about 2.6 s slower than the laptop. Cloud also still spends 1.3 s more on browser time than local Chrome.
Cloud charged $0.0061 per run, down from about $0.015 on Sep 27, which included default-proxy bandwidth (browser hours are in neither number).
The Python library had the same problem
browser-use 1.0 took 153 s longer per task than Pi on BU Bench v2. The agent found three per-call taxes (compaction requested on every request, the OpenAI SDK walking every request body, and store: true), and making accessibility-tree mode the default took off another 173 s per task, at a 6-10 point lower pass rate, a risk we flagged.
What failed
The agents were good at splitting a gap into causes and at saying when they missed a prediction (they pre-registered 17-19 s for Flights, measured 20.5 s and said so). They also:
- Edited files mid-benchmark, which threw away five runs.
- Read judge noise as signal. We now require at least 6 runs per task for any quality claim.
- In a separate overnight push on fast paths for repeated tasks, agents kept polishing 12% wins until we reset the target to 75-90% faster. The overnight "-65% at equal accuracy" claim then failed its rerun: accuracy was 9.7 points lower.
The branches are public: Browser Use Pi keeps 30 exp/* branches from Sep 26-30, losers included.
Speed only counts at matched correctness. A prototype that restricted what the agent could do took Flights from 9.5 to 7.1 s and from 1,092 CDP calls to 101 (3 matched pairs, timer starting after the first page read, so don't compare it to the times above). On a broad 100-task benchmark it passed 1 of 100. Reasoning effort is the same trade: on 200 hard tasks (BU Bench v2.1, 1 run each), low effort had a median of 170 s at score 0.352 and medium 441 s at 0.643. Ultrafast is for short tasks. For long ones use bu-fast.
To try it, set model to bu-ultrafast in Browser Use Cloud.
